Petroleum Refining in the United States and its Economical and Environmental Concerns

Ever since the first oil well was drilled in 1859, there has been an increased demand in petroleum in the United States.1 This is because petroleum was found to have many different uses since it could have different properties depending on what temperatures the petroleum was distilled at. In order to do this process, oil refineries were built in order to get useful products while removing the harmful side products of the process. The first refinery in the United States was opened in 1861.1 This shows that people saw the importance of processing the petroleum and moved quickly to build a refinery to do so. With the invention of the internal combustion engine the demand for gasoline has grown dramatically over the years.

In 2013 the United States had a total oil production of 12.316 million barrels.2 Even though this is a large amount that was produced, it was still less than the consumption of 18.49 million barrels in 2013.2 Therefore the United States needed to import oil in order to meet this demand. Data from 2012 shows that approximately 40% of the petroleum consumed was from exports.3 Surprisingly a little over 50% of the imports came from the Western Hemisphere with Canada being the largest crude oil supplier to the United States.3 This shows that there is less of a demand in the political unrest in the Middle Eastern region. Since 2005 the demand for imported oil has declined. After the recession in 2008 the consumption of oil was lesser and there was a focus on increasing the efficiency as well as the increase in the use of biofuels such as ethanol and biodiesel.3 The discovery of the Marcellus and Utica Shale formations in Pennsylvania has led to the finding of tight oil that adds to the total oil reserves in the United States, which makes it possible for the United States to import less.6

In 2012 37% of energy in the United States came from the consumption of petroleum.4 Even though renewable fuels and natural gas are having a greater impact, petroleum is still the largest energy source. This means that oil refineries have a large job to fulfill. The refineries have the capacity to process large amounts of crude oil, but also must take into consideration the environmental impact that the refineries have. Refineries consume a large amount themselves as they are distilling the crude oil to form the final products. There are restrictions on the CO2 emissions as well as on the hazardous byproducts of the process. When petroleum products are burned in an internal combustion engine several harmful products are created. These include carbon dioxide, which is a greenhouse gas, carbon monoxide, sulfur dioxide, which contributes to acid rain, nitrogen oxides, volatile organic compounds, and particulate matter.5 All of these negatively impact the environment and human health. Therefore the government strictly enforcing regulations on refineries and how they process the crude oil in order to limit the harmful byproducts. It does not mean there will be a large decrease in the consumption of petroleum fuels in internal combustion engines, but that refineries will be forces to formulate the fuels in a way that limit the environmental and health concerns.

References

1.)    Gary, James H., Handwerk, Glenn E., Kaiser, Mark J. Petroleum Refining Technology and Economics. Taylor and Francis Group. Florida. 2007. Print.

2.)    http://www.eia.gov/countries/country-data.cfm?fips=US

3.)    http://www.eia.gov/energy_in_brief/article/foreign_oil_dependence.cfm

4.)    http://www.eia.gov/forecasts/aeo/er/early_fuel.cfm

5.)    http://www.eia.gov/energyexplained/index.cfm?page=oil_environment

6.)    http://www.eia.gov/tools/faqs/faq.cfm?id=847&t=6


The Current Supply of Petroleum Fuels and their Environmental Effects

In finding the required data to complete this assignment, the U.S. Energy Information Administration website was used. From the homepage I used the Sources and Uses dropdown menu to find the “Weekly Petroleum Status Report” (on the right hand side of the dropdown menu) which gave data up to the middle of May. This data was logged for various topics such as weekly U.S. field production, imports, exports, U.S. refiner and blender net production, and the product supplied for a small number of refinery products.

When beginning to look at the numbers, it can be seen that there is a total input of crude oil to U.S. refineries of 15,949 thousand barrels per day (KBPD), the majority of which is actually produced domestically (8,434 KBPD versus 6,469 KBPD imported)1. This is somewhat surprising at first; however if the table is followed backward we can see that there has been a 14% increase in U.S. production and a 5.3% drop in imports since last year1. What can be drawn from this is that America, while still being heavily reliant on oil, is currently becoming slightly less dependent on foreign oil. With this being said, the U.S. is still importing over 4,500 KBPD from Canada, Saudi Arabia, and Mexico alone2. On top of the increase in domestic fuel production there has also been an increase in crude oil exported from the U.S. As of May 16th America exported 71 KBPD which is up from 48 KBPD last year at this time1.

Taking a step backward for a moment, it might beneficial to look in to not just the overall numbers but also the values of specific refinery products such as gasoline, kerosene, and distillate fuel oils. These three products are shown to be the largest components of refinery production currently because they are used as fuels in transportation methods3. When I was investigating these numbers I realized these were the stocks or supplies of each type of fuel in millions of barrels. So as of mid May the U.S. had a stock of 213 million barrels of gasoline, 39 million barrels of kerosene, and 116 million barrels of distillate fuel oil3. Although this seems like a large amount of each, to put things in perspective, America’s Strategic Petroleum Reserve can hold up to 727 million barrels of oil so these values are not all that large4. Once again looking at the fluctuations of these stocks it can be seen that gasoline and distillate fuel oil have actually decreased since this time last year while kerosene increased. There are several factors that could lead to these decreases however I believe it could be partly due to Americans driving less as gasoline prices rise5. With fewer miles being driven there may be less need to keep a large amounts of gasoline or distillate fuel oil stored up in case of emergency.

In the refining of crude oil there are several processes done to improve the quality of the oil products so that they meet environmental specifications set by the state and federal government. Refineries must reduce or remove the amount of nitrogen, sulfur, and organometallic compounds in the crude oil to acceptable levels. For instance, nitrogen and sulfur content can be reduced through the use of hydrotreating or hydrodesulfurization which cuts down on NOx and SOx emissions during combustion. Organometallics include elements like nickel, vanadium, and copper must also be taken out due to their highly corrosive and toxic natures.

References:

  1. “Weekly Petroleum Status Report.” U.S. Energy Information Administration . N.p., n.d. Web. 25 May 2014. <http://www.eia.gov/petroleum/supply/weekly/pdf/table1.pdf>.
  2. “Weekly Petroleum Status Report.” U.S. Energy Information Administration. N.p., n.d. Web. 25 May 2014. <http://www.eia.gov/petroleum/supply/weekly/pdf/table8.pdf>.
  3. “Weekly Petroleum Status Report.” U.S. Energy Information Administration . N.p., n.d. Web. 25 May 2014. <http://www.eia.gov/petroleum/supply/weekly/pdf/table4.pdf>.
  4. “Strategic Petroleum Reserve.” ENERGY.GOV. N.p., n.d. Web. 25 May 2014. <http://energy.gov/fe/services/petroleum-reserves/strategic-petroleum-reservev>.
  5. “U.S. Energy Information Administration – EIA – Independent Statistics and Analysis.” Table 5.24 Retail Motor Gasoline and On-Highway Diesel Fuel Prices, 1949-2011 (Dollars per Gallon). N.p., n.d. Web. 25 May 2014. <http://www.eia.gov/totalenergy/data/annual/showtext.cfm?t=ptb0524>.

The U.S Dependency on Foreign Oil and the Environmental Impacts from Petroleum Refining

Since the drilling of the first petroleum well in Titusville, Pa, the United States has become increasing more dependent on the “liquid gold”. In order to quench the appetite for the gasoline and diesel demand of internal combustion engine use, a refinery had to be built.[1] The purpose of these refineries are to increase the yield of desired products, while removing harmful compounds that can affect the environment during the combustion process. In order to understand the importance of refineries, this entry will summarize the dependency of foreign crude imports, the compositions of a barrel of crude oil, and finally the methods used in a refinery process/ their purposes.

In 2013 the United States consumed roughly 6.89 billion barrels of refined crude oil products.[2] Of these 6.89 billion barrels of crude oil, the majority of the supply did not come from the foreign imports. This was shocking because traditionally the United States imported roughly 60% of its demand from foreign countries.1 As of 2012, the United States only relied on foreign sources for 40% of its total crude consumption.[3] The reason for this drastic change could be due to many reasons but, to me, the biggest catalyst for this change was the United States economic recession in 2008. The price per barrel of crude oil was steady trending upward, but in 2008 a barrel of crude drastically rose from $66.52 to $94.04.[4] This large increase of price may have been a driver that forced the United States to steer away from foreign imports and produce more domestic oil/ research alternative fuels such as natural gas.

The term “Barrel” in the petroleum field refers to a drum that contains 42 gallons of crude oil.[5] Within that crude oil there are multiple components that can be extracted after the refining process. A single barrel of crude can contain roughly 50% gasoline, 15% distillate fuel oil (diesel fuel and heating oil), 12% jet fuel, and trace amounts of other compounds.[5] Based on the demand of a specific type of fuel a refinery will be able to tailor its production to accommodate for the specific fuel need.

Up until the establishment of the first U.S oil refinery, built in 1861, petroleum products weren’t so easily separated into a desired fuel.[1] In order to grasp the importance of refining it is necessary to understand the five basic steps of the refining process and ultimately the impact certain steps have on the environment after the fuel is combusted. The five steps in the refining process are distillation, conversion processing, treatment, blending, and compound extraction from other refining options. Distillation is the process that separates fuels based off of their boiling point and compound sizes; Conversion processing is used to manipulate chemical structures to form different fuels from thermal cracking, catalytic cracking, and other methods; Treatment processing is used to remove any undesired compounds and chemicals from the fuels; Blending allows for the fuel to be improved for performance and temperature conditions with the introduction of additives; and compound extraction processing allows for the recovery of certain compounds and the treatment of various refinery fluids. Of the five processes, the treatment process of the crude has the most environmental impact. During this process, the fuels undergo procedures to remove wax, sulfur, disulfides, and coke.[1] The removal of these compounds allow for there to be a reduced production of harmful emissions such as carbon monoxide and sulfur dioxide during the combustion process. For example, currently 60% of the diesel produced is of low sulfur content (15 ppm).[1]

1. Gary, J. H., & Handwerk, G. E. (2007). Petroleum refining: technology and economics. New York: M. Dekker.
2. How much oil is consumed by the United States?. (n.d.). . Retrieved May 14, 0025, from www.eia.gov/tools/faqs/faq.cfm?id=33&t=6
3. How dependent is the United States on foreign oil?. (n.d.). . Retrieved May 14, 0025, from www.eia.gov/tools/faqs/faq.cfm?id=32&t=6
4. U.S crude oil first purchase price. (n.d.). . Retrieved May 14, 0025, from www.eia.gov/dnav/pet/hist/LeafHandler.ashx?n=pet&s=f000000__3&f=a
5. What does one barrel of crude oil make?. (n.d.). . Retrieved May 14, 0025, from http://www.californiagasprices.com/crude_products.aspx

The Diesel Engine’s Shining Moment!

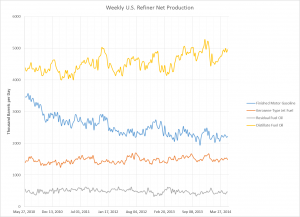
Fig 1.1 Weekly U.S. Refiner Net ProductionFig. 1 Finished Motor Gasoline does not include blending components

The EIA provides a plethora of data on U.S. petroleum fuels production. The “Weekly U.S. Refiner Net Production” graph (Fig. 1) illustrates the comprehensive “Weekly Petroleum Status Report”. The “WPSR Highlights” provide a condensed sketch of the report. During the week ending May 16, 2014, U.S. refineries operated at 88.7% capacity, consuming 15.9 million barrels of crude oil per day and producing 9.6 million barrels of gasoline and 5.0 milion barrels of distillate fuel oil. The U.S. imported 6.5 million barrels per day as well as over 1.1 million barrels of finished gasoline, gasoline blending components, and distillate fuel. Given that roughly 60% of a barrel of crude oil is used to produce gasoline, diesel fuel, and heating oil, and thus that imports account for 3.5 times that of finished imports, it is safe to say that U.S. refineries are essential components in the U.S. As my classmate readily points out, the U.S. is bridging the gap between imports and exports. However, it is unclear whether the domestic production is sustainable. As tight oil extraction continues, the world is only one subsea engineering feat away from revitalizing easy oil.

Along with weekly reviews, the EIA provides quarterly forecasts of the petroleum fuels market. As Memorial Day approaches and summer vacations commence, the EIA predicts the price of gasoline to increase slightly above the prices from this time last year before dipping below last year’s numbers for the remainder of the year. This trend correlates to crude oil prices, and ultimately results from an expected overproduction from the non-OPEC supply, especially in North America.

The most notable trend in Fig. 1 is noted in the Annual Energy Outlook 2014: gasoline production is declining while distillate fuel production increases. The EIA anticipates more gasoline-producing refineries to either convert to distillates or increase capacity to meet the market demand.

U.S. crude oil stocks are very high compared to the 5-year average. The distillate fuel stock is below average which might also imply a regression to the mean with increased imports and domestic refinery capacity.

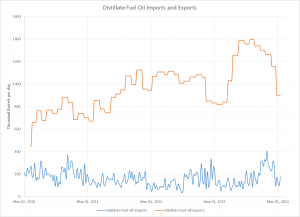
Fig 1.2 Distillate Fuel Oil Imports ExportsFig. 2 Distillate fuel oil includes No. 1, No. 2, and No. 4 distillate

Notably, the conflict in Crimea may not have noticeably impacted the recent refinery outputs, but it may account for the decline in U.S. exports of distillate fuel oil. While distillate fuel oil consists of many uses, from space heating to diesel engines, “Distillate Fuel Oil Imports and Exports” (Fig. 2) displays a sharp decrease in exports and imports after the week of Russia’s occupation of Crimea. Despite this period of March, April, and May being termed the refinery maintenance season, this span of time includes a critical period of market uncertainty. Crimea already faces fuel shortages. Germany could face price surges, as pressure increases to diversify crude oil and natural gas imports.

The refinery exemplifies the peak of fuel chemistry application, with each refinery having unique capacity, inputs, and products. The environmental concerns posed by greenhouse gas emissions from internal combustion engines is mitigated within the refining process. A baghouse is used to capture particulate matter. Sulfur content may be removed through hydrodesulfurization or hydrotreating. Volatile metallic compounds are extracted by precipitation using a solvent such as propane. All of these processes are either energy-intensive and/or materials intensive, and would greatly benefit from regenerative solvents and materials.

References:

  1. Pricing Highlights: http://www.eia.gov/petroleum/marketing/monthly/pdf/hilites.pdf
  2. Supply Overview: http://www.eia.gov/petroleum/supply/weekly/pdf/highlights.pdf
  3. http://www.nytimes.com/2014/05/18/world/europe/in-taking-crimea-putin-gains-a-sea-of-fuel-reserves.html?_r=0
  4. http://www.reuters.com/article/2014/04/25/ukraine-crisis-crimea-energy-idUSL6N0NH4NR20140425
  5. http://www.eia.gov/forecasts/steo/special/summer/2014_summer_fuels.pdf
  6. Supply Data: “blog 1 data.xls”
  7. Petroleum Refining

Supply of Petroleum Fuels in the United States and Petroleum Fuels in Internal Combustion Engines

The most notable change in the supply of petroleum fuels for the United States is the drastic growth in domestic production of both natural gas and crude oil. The development of production in tight formations, or shale formations (particularly the now well-known Marcellus Shale in the Northeastern United States) combined with the technological advances (hydraulic fracturing and directional drilling), has had far-reaching effects, including decreased both dependency on and imports from other countries. The largest change is from Africa, with imports from that region decreasing by 90% from 2010 to 2014. For comparison, 2008 tight oil production accounted for only 12% of US production, while in 2012 the number rose to 35%. By 2019, we can expect half of US oil production to be from tight oil formations. This increased domestic production has also reduced costs, allowed prices to decrease, and making natural gas a viable and inexpensive alternative to coal in the generation of electricity. While increased use of natural gas in the electricity generation sector is partially environmental policy-driven, much of this growth can be attributed to the mechanics of a price competitive market. This change is beneficial, as when comparing these two sources of energy, combustion of natural gas produces far less carbon dioxide, nitrogen oxides, and sulfur emissions than coal. Natural gas also does not contain harmful particulate matter such as mercury. Furthermore, there have also been advances in other renewable sources of energy including wind and solar power. As these sources become more competitive as costs decrease, we can expect renewable electricity generation to account for 16% of total electricity generation in the United States by 2040.

There have been many positive changes regarding the environmental concerns from combustion of petroleum fuels in internal combustion engines. Though the total miles driven and vehicles used have increased (total vehicle miles traveled increasing by 0.9% each year), it has been more than offset by the increased fuel efficiency of engines. Strict regulations and standards set in place have forced manufacturers to develop better and cleaner vehicles. The EIA website states that light-duty vehicle fuel efficiency has increased by nearly 2% each year, and can be expected to reach 37.2 miles per gallon by 2040 from 21.5 mpg in 2012. Additionally, the entire nation has been slowly and gradually moving towards diesel fuels, biofuels, hybrid, and completely electric cars (most notably Tesla, with massive growth in recent years). Overall, I believe that the United States is moving in the right direction with regards to environmental policy and sustainability. However, this is a global issue and countries such as China and India must also follow suit (though India’s new prime minister has stated that the entire country will be moving towards solar powered homes, hoping that each home is powered by the year 2019).

References:

1. Gary, J. H., & Handwerk, G. E. (2007). Petroleum refining: technology and economics. New York: M. Dekker.

2. The Availability and Price of Petroleum and Petroleum Products Produced in Countries Other Than Iran,  http://www.eia.gov/analysis/requests/ndaa/?src=Petroleum-f7

3. U.S. Crude Oil and Natural Gas Proved http://www.eia.gov/naturalgas/crudeoilreserves/?src=Petroleum-f8

Switch from importer to exporter and the importance of refining process at environmental level

On US Energy information administration (eia) website, it provides the date of US petroleum supply from 1956 to early 2014. From this data, the US ending stocks of crude oil and petroleum products has a trend of increasing during these decades. During 1950’s to 1980’s, the ending stocks increase rapidly. From 1990’s to 2003, it has a few down times and up times. From 2003 to now, it has two large increasing time periods. However, during the most recent a few months, the ending stocks decreased compare to that in early 2013. If looking at US product supply of crude oil and petroleum products, the product supply increase steady from 1981 to 2008. Then it is a down curve from 2008 to 2013. It may due to the recession in 2008, but the products supply increase in early 2014. The average US product supply of crude oil and petroleum product is 18,541 thousand barrels per month. Overall, the products supply of US crude oil and products is recovering from the recession. The trend of ending stocks and product supply is keeping increasing.

Refer to lesson 1 slides, US expects to switch from an importer to an exporter during these decades. If looking at the US imports of crude oil and petroleum products, the amounts of imports is in an increasing trend from 1981 to 2006. In 2006, it reached a peak of amounts of imports. US imported 5,003,082 thousand barrels in 2006. On the other hand, the US exports of crude oil and petroleum products are always in an increasing trend from 1981 to 2014. In 1981, US exported 217,024 thousand barrels. In 2013, US exported about 1,311,830 thousand barrels. The amount of exports of crude oil and petroleum products is about six times as many as that in 1981. The imports of crude oil and petroleum products are decreasing while the exports of crude oil and petroleum products are increasing. Also with an increasing US ending stocks and product supplied of crude oil  and petroleum products, US actually is switching from an importer to an exporter right now. In the future, as the technology of refining and producing of petroleum, US will be an exporter of crude oil and petroleum products sooner than later.

As the supply and demand of petroleum increase in the future, environment issues occur during refining process. Like the lesson one slide stated, there are three types of pollution produced during the refining process. As air pollution, CO, PM, NO, SO and H2S are produced during refining process. The more effective gas collect process is necessary for refining process.  As water pollution, it affects both ground water and surface water. The polluted water comes from various process of refining such as cracking, desalting, and cooling. This kind of water should go through some process to be cleaned before release. As solid pollution, it is probably less harmful compare to air pollution. The solid waste could be recycled by several processes and could be cleaned up by bacteria which eat these by-products. In order to help environment issue from refining process, help from government and understanding from community are needed. There are many acts and policies help to regular the pollution from refining process. As refining technologies improving in the future, there will be less pollution during process but more efficient petroleum products.

References

1. Summary of Environment and Social Impacts for Activates Associated with Petroleum Refining and the Storage of Petroleum Products

http://www.ebrd.com/environment/emanual/subsecs/Impact_Summary_Petroleum_Refineries_and_Storage.pdf

2. Supply and disposition of crude oil and petroleum products, US Energy information administration

http://www.eia.gov/dnav/pet/pet_sum_snd_d_nus_mbbl_m_cur.htm

3. Speight, J. G. (2005). Environmental analysis and technology for the refining industry. Hoboken, N.J: Wiley-Interscience.


Supply of Petroleum Fuels Is The United States And How To Address Environmental Concerns From Combustion of Petroleum Fuels In Internal Combustion Engines.

Kyle Tress, krt5109@psu.edu , Tuesday May 20, 2014

The most recent data on the Supply of petroleum products in the United States is from the U.S. Energy Information Administration (eia) from February 2014. When looking at just the field production, the total supplied Crude Oil and Petroleum Products totaled on average 10,717 (Thousand Barrels per day).1 In the prior months it was at 10,644 in January 2014, and 10,517 in December 2013.1 In general there has been a trend of increasing supply of petroleum products in recent years, with the last decrease from 10,462 in September 2013, to 10,392 in October of 2013.1 When looking at the annual data from as far back as 1970’s, the peak recorded supply was around 1973 with 10,975, then in general decreased till around 2006 with 6,860.1 From that point on there has been an increasing amount supplied to the market with the current data recorded in 2013 with an average of 10,003.1

When looking at February alone in the U.S. there was an additional 1,109 (Thousand Barrels per day) inputs from Renewable Fuels and Oxygenate Plant Net Production, 18,652 from Refinery and Blender net Production, 9,151 from imports, and 651 from Adjustments, all of which except for imports are up from the prior recorded data in January of 2014.1 In recent years there has been a decreasing number of inputs from the peak in 2006 at 13,707, to 9,764 (Thousand Barrels per day), based on an average of the annual data.1

When looking at the disposition of these supplies 14 (Thousand Barrels per day) was Stock Change, 17,572 Refinery and Blender Net Inputs, 3,611 Exports, 18,994 Products Supplied, as recorded from the eia data in February 2014.1 The number of products supplied is up from 18,921 in January 2014, but down from 19,081 back in December of 2013.1 The numbers of exports are as well down from 4,021 in January 2014, and down from 4,444 in December of 2013.1 The trend in recent years have however been an increasing number of exports based on an average of the annual data from a low of 971 in 2001, to the current high of 3,594 in 2013.1

Examining the types of products supplied to the market in February of 2014, 3,461 (Thousand Barrels per day) was from Natural Gas Plant Liquids and Liquefied Refinery Gases such as Ethane and Propane.1 An additional 1,927 went to other liquids such as Ethanol and Unfinished oils.1 There were finally 18,716 to finished petroleum products such as kerosene, finished motor Gasoline, or residual fuel oil.1 The largest portion of Finished Petroleum Products came mostly from Refinery and Blender Net Production with 18,135 as recorded in February of 2014.1 This is up from the 18,082 in January of 2014, but down from the 19,193 supplied in December of 2013.1 When examining the average based on annual data there has been a general upward trend of increasing Finisher Petroleum products Supplied from U.S. Refinery and Blender Production. There was however a decrease in 2012 with 17,934 from the 18,054 in 2011, but quickly increased again to the current high of 18,417 in 2010.1

With petroleum fuels in internal combustion engines a concern that must be addressed in the environmental impact that will occur, due to the source of anthropogenic pollution. This can include such emissions as NOx, PM10, PM2.5, VOCs, SOx, and CO.2 This can be done by making thefuel cleaner as the refinery level. The first method is to reduce the sulfur content. Sulfur can inhibit the effectiveness of catalytic converters, so reducing the sulfur content make the fuel work more effectively and reducing tailpipe emissions.3 The second method is to reduce the benzene content. Benzene is a cancer causing risk to humans, so reducing the content reduces the cancer risks.3 A third method is to reduce the levels of aromatics hydrocarbons and the level of olefins, which react readily with other pollutants to form smog. Another method is to reduce the vapor pressure, which ensures that the fuel evaporates more readily. The final methods are to use an oxygen-containing additive which helps the fuel combust completely and burn cleaner.3

References

  1. Supply and Disposition of Petroleum and Other Liquids, Energy Information Administration, From:http://www.eia.gov/dnav/pet/pet_sum_snd_d_nus_mbblpd_m_cur.htm
  1. An Assessment of the Environmental Implications of Oil and Gas Production: A Regional Case Study, September 2008, Sector Strategies.
  1. Cleaner-Burning Gasoline: An Update, September 25, 2008, California Environmental Protection Agency, From:http://www.arb.ca.gov/fuels/gasoline/cbgupdat.htm